Hospitality Industry At A Glance
Discover the latest economic trends and data shaping North Carolina’s vibrant hospitality sector. As the North Carolina Restaurant & Lodging Association, we are committed to providing valuable insights that reflect the industry’s health and progress.
Representing over 20,000 businesses and a significant portion of the state’s workforce, NCRLA is dedicated to advancing and protecting the interests of an industry that generates over $35.8 billion in annual sales. Stay informed and ahead with the latest economic data at your fingertips.
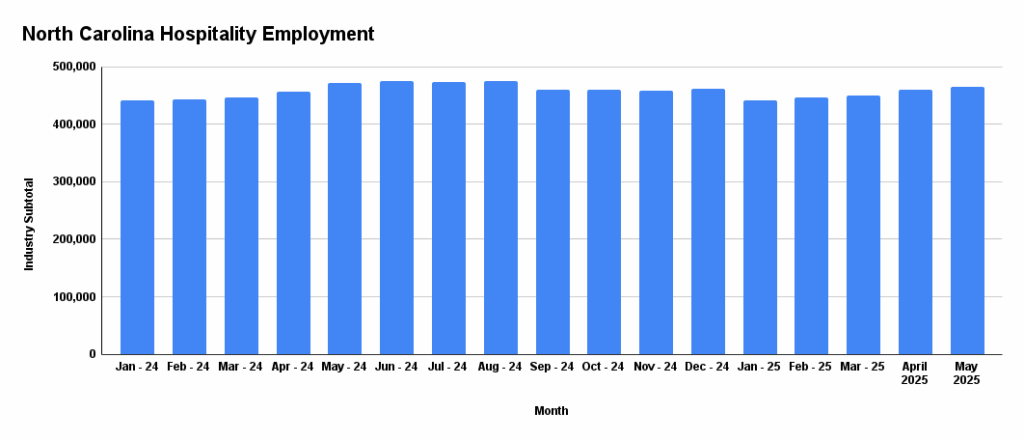
Current Employment Statistics (CES)
Detailed employment figures in North Carolina’s hospitality industry, courtesy of the North Carolina Department of Commerce.

| Sector | May 2025 | (+/-) Change May 2024 |
|---|---|---|
| Foodservice & Drinking Places | 418,400 | – 5,900 |
| Accommodations | 47,200 | + 200 |
| Industry Total | 465,600 | + 5,700 |
Monthly Sales and Use Tax Statistics
Insightful data from the North Carolina Department of Revenue, reflecting the financial dynamics of the sector.
April 2025 Taxable Sales & Purchases for NC’s Hospitality Industry
| Sector | April 2025 | % Change April 2024 |
|---|---|---|
| Restaurants | $2,347,796,478 | + 2.38% |
| Taverns | $117,461,498 | – 0.67% |
| Hotels | $597,062,856 | + 3.46% |
| Industry Total | $3,062,320,832 | + 2.47% |
Lodging Economic Data
A focused analysis from Smith Travel Research, featuring key metrics like Occupancy Rate, Average Daily Rate (ADR), and Revenue Per Available Room (RevPAR) for lodging establishments across the state.
May 2025
64.9%
Occupancy Rate
$138.86
Average Daily Rate
$90.18
Revenue Per Available Room
Source: Smith Travel Research

